The project focuses on conducting an in-depth analysis of weekly sales driven by various media channels and organic search metrics. In a data-driven marketing landscape, understanding how each channel contributes to sales is crucial for optimizing ROI. The analysis works with a weekly dataset incorporating multiple variables like TV GRPs, radio, newspaper, search clicks, and organic search topics.
Data Cleaning and Preprocessing
Data cleaning is a crucial step, setting the stage for the entire analysis. In this project, the raw dataset undergoes transformations to deal with any missing or outlier values. Special attention is given to ensuring that all variables are in a suitable format for statistical modeling, specifically as numeric types suitable for regression analysis.
Exploratory Data Analysis (EDA)
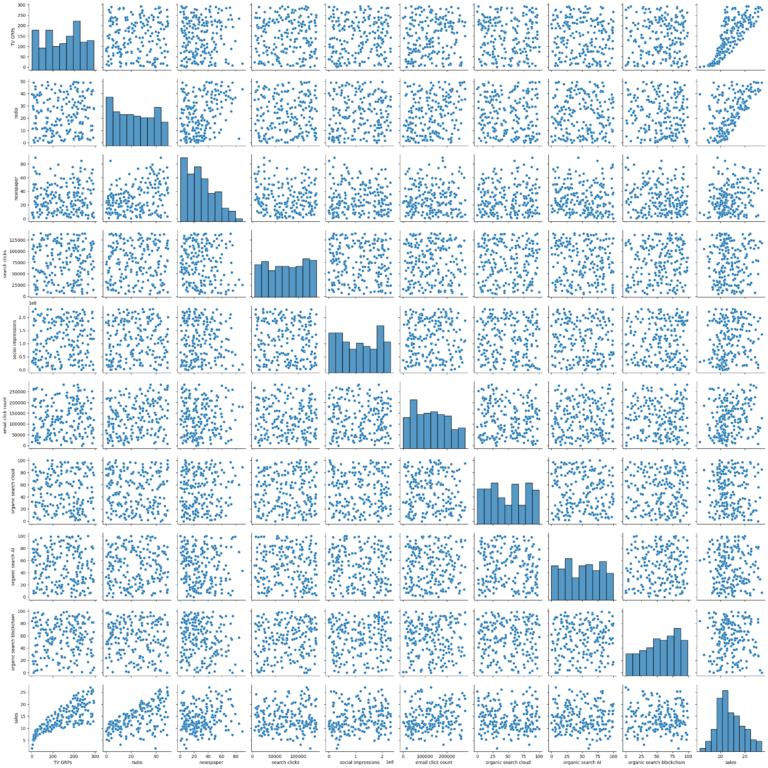
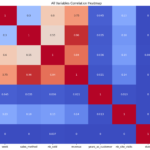
The EDA stage involves diving deep into each variable to understand its distribution, potential outliers, and overall impact on sales. Box plots, scatter plots, and correlation heatmaps are used to visualize the relationships between each independent variable and the dependent variable, sales. Initial findings indicate that variables like ‘TV GRPs’ and ‘radio’ have more significant impacts on sales compared to others like ‘newspaper’ and ‘organic search cloud.’
Modeling and Analysis
An Ordinary Least Squares (OLS) regression model was used for this analysis. The model has an impressively high R-squared value of 0.896 and an adjusted R-squared of 0.890, demonstrating excellent fit. However, it’s worth noting that the condition number was extremely high, indicating potential multicollinearity, and the Jarque-Bera test indicated that residuals are not normally distributed. These are areas that may require further investigation.
Key Insights
The project uncovers that ‘TV GRPs’ and ‘radio’ are robust predictors for sales, while ‘newspaper’ and several organic search metrics seem to have less direct impact. Price elasticity is analyzed to understand how different levels of spending in these channels could affect sales. Additionally, we notice a potential issue of multicollinearity among some variables, indicating a need for further study.
Recommendations
Based on the findings, businesses should allocate a larger share of their advertising budget to TV and radio advertising. On the flip side, spending on channels with low impact on sales, like newspapers, could be reassessed.
Conclusion and Future Work
The project provides a comprehensive model to understand how different media and organic metrics contribute to weekly sales. These insights are instrumental for businesses to optimize their marketing spend and improve ROI. Future work could include integrating more granular data, such as demographic information or seasonal trends, to improve the model’s accuracy further.
This project focuses on leveraging the capabilities of Google Cloud SQL and Google Colab to manage, analyze, and visualize data stored in an SQL Server instance. It covers a wide array of functionalities that not only involve basic table creation and data insertion but also extend to advanced queries, data manipulation, and procedural automation. Below are some of the real-world applications and benefits of this multi-faceted project:
Real-Life Uses:
- Business Analytics: This setup can help businesses understand their customer behavior better by performing complex queries like calculating total purchases and discounts or determining product popularity.
- Inventory Management: With functionalities like ‘Top5BestSelling’ views and stored procedures to update product discounts, businesses can make informed decisions regarding stock replenishment and pricing strategies.
- Security: Features such as card masking and password updating by email offer enhanced security measures in line with best practices for data management.
- Financial Auditing: The ability to display various formats of product prices, orders, and customer spending can facilitate easier auditing and compliance checks.
- Customer Relationship Management (CRM): This platform offers multiple ways to better understand customer interactions with the business, ranging from sorting them by last name to identifying their smallest and largest orders.
- E-Commerce: Displaying shipping details, verifying new customer entries, and tracking order statuses are essential functionalities for maintaining a reliable e-commerce platform.
Key Functions:
- Initial Setup and Management: Establish a SQL Server Instance in Google Cloud SQL, accessible from Google Colab.
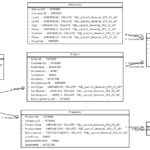
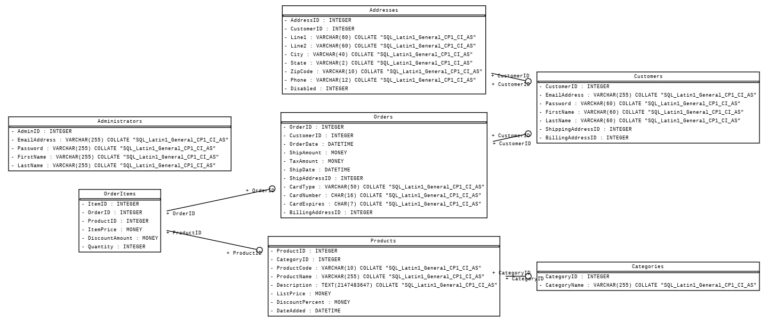
- Data Manipulation: Functions to create tables and insert data, covering tables like ‘Orders’ and ‘Customers.’
- Data Querying and Visualization: Various types of queries like sorting, filtering, and calculating are carried out on tables. Examples include filtering customers by last name, displaying orders sorted by shipping date, and calculating total purchase values.
- Advanced Queries and Views: Creation of more advanced SQL views and functionalities like ‘Order Item Product Details’ and ‘Top5BestSelling’ to serve complex analytical needs.
- Stored Procedures and Automation: Setting up and testing stored procedures for tasks like updating product discounts.
- Data Formatting and Security: Functions to display data in multiple formats and mask sensitive information like card details.
- Data Validation and Updating: Functions to add and verify new customer entries and to update and verify customer passwords.
- Mathematical and Financial Calculations: Functions to perform mathematical operations like finding common divisors and calculating discounted prices.
Conclusion:
This project serves as a robust solution for database management and analytics, tailored for both small and large-scale operations. By leveraging Google’s cloud capabilities, it offers a scalable, secure, and versatile platform for a variety of real-world applications in business and data analytics.
The goal of this project is to meticulously analyze and understand the global trends and patterns in the field of artificial intelligence (AI), an area that is increasingly at the forefront of technological advancements. By recognizing the growing need for detailed insights into AI-related research and applications, our project has been meticulously designed to provide an in-depth examination of AI-related data. The analysis is split into two crucial components: SQL and Python, each serving a unique purpose in achieving the objectives of the project.
SQL Part:
The SQL section focuses on creating a well-structured database and conducting a comprehensive investigation into AI publications. By creating specific tables, we can organize general publication information and AI-related details separately. The aim here is not only to collect and organize the data but also to ensure its quality and integrity. Furthermore, an in-depth analysis of the contributions of Chinese authors in AI publications adds a geographical dimension to our exploration, helping us understand China’s role in the global AI landscape.
Python Part:
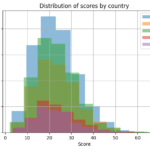
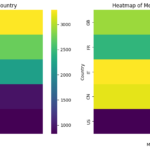
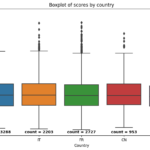
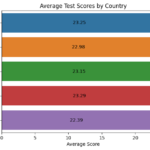
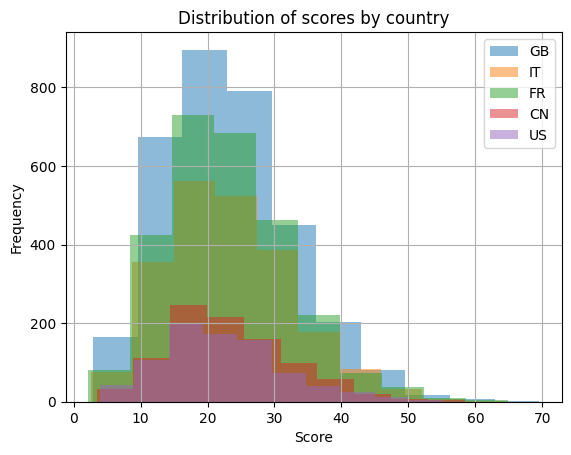
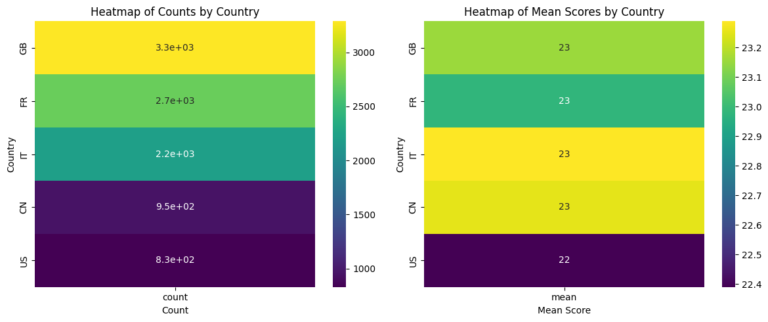
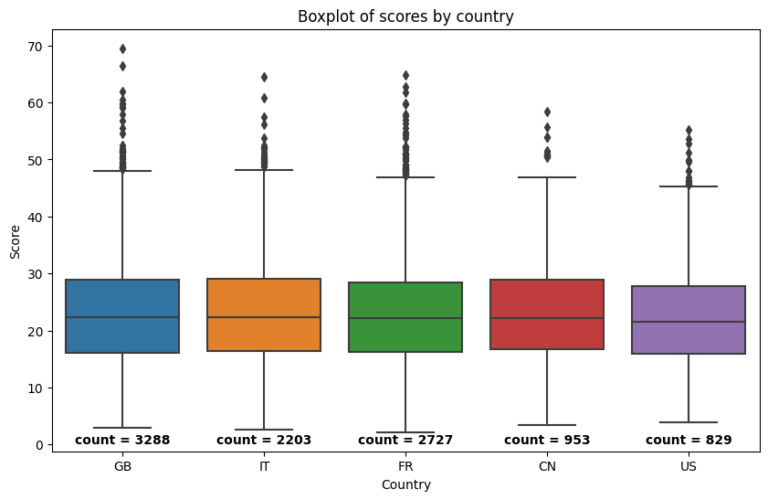
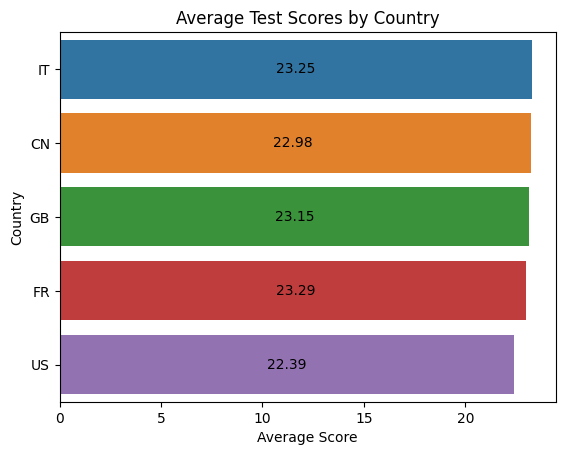
Shifting from the realm of publications to practical applications, the Python part of the project dives into a synthetic dataset containing scores from an AI-related test conducted by researchers across five countries. Through mathematical computations, we derive insightful statistics, summarizing the test scores both numerically and visually. The use of histograms and heatmaps helps in presenting a clear picture of the average performance of the participating countries.
Together, the SQL and Python segments form a multifaceted analysis of AI-related data. By employing a combination of database management, statistical calculations, and data visualization, the project aims to shed light on various aspects of the rapidly evolving field of AI. The insights gained from this study will contribute to our understanding of global participation in AI research and innovation, facilitating further advancements and collaborations.
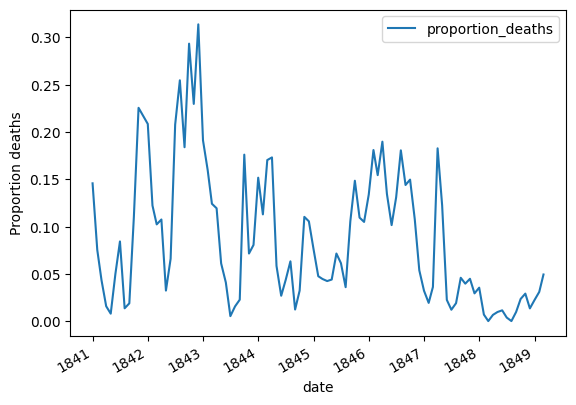
This is a comprehensive statistical analysis focused on the historical medical records of childbed fever mortality rates at Vienna General Hospital during the 1840s. Here’s an overview:
1. Introduction and Objective: The study begins with an exploration of Dr. Ignaz Semmelweis’s work in uncovering handwashing’s vital role in thwarting childbed fever.
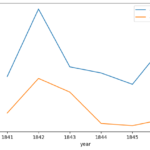
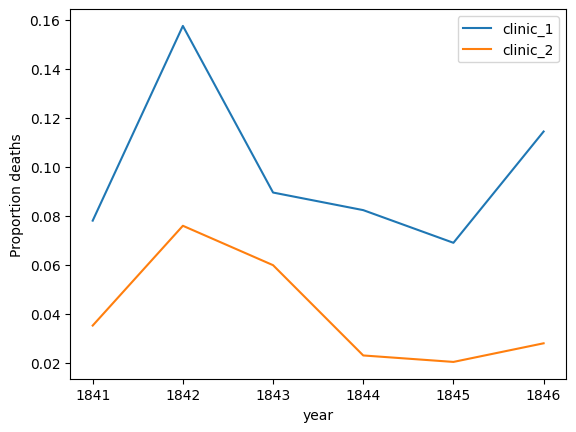
2. Data Collection and Preparation: Key datasets were imported, containing yearly and monthly information about births and deaths in two different clinics. From this, essential statistics were calculated to provide an initial understanding of the issue.
3. Visual Analysis: By utilizing Matplotlib, alarming mortality figures were compared between two clinics, and the data was visually represented.
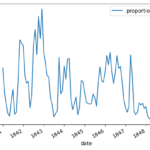
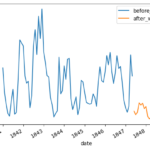
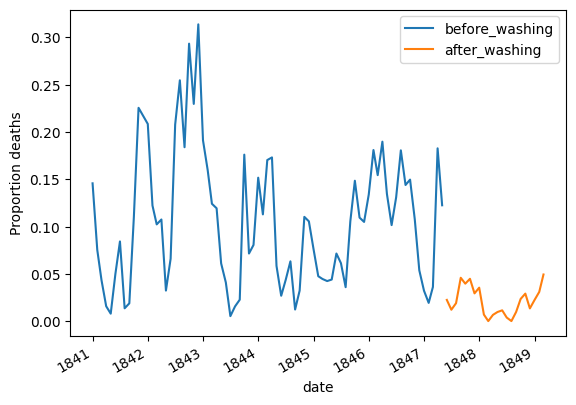
4. Impact of Handwashing: The time period when handwashing was introduced was analyzed, and its impact on mortality rates was illustrated through compelling visualizations.
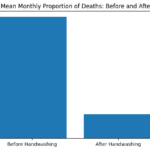
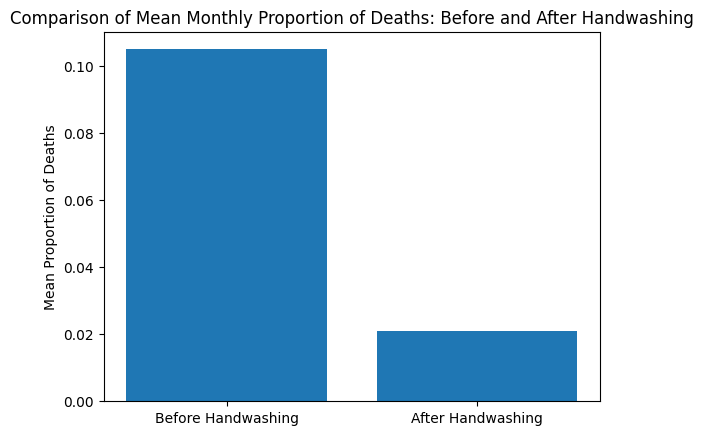
5. Quantitative Assessment: The study quantified the handwashing effect by contrasting mean proportions of deaths before and after its mandatory implementation, revealing a significant reduction.
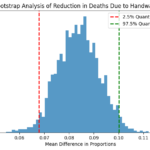
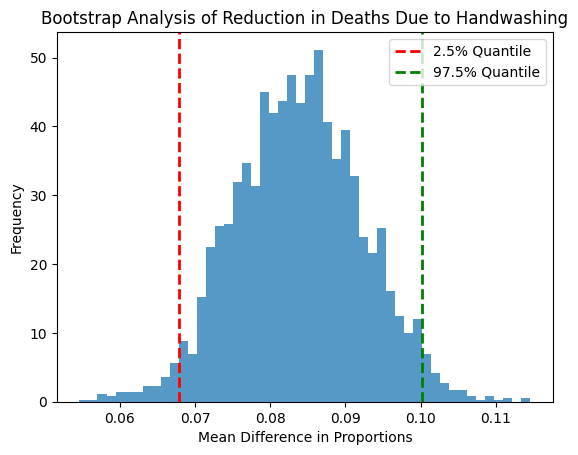
6. Bootstrap Analysis: A bootstrap analysis was conducted to understand the uncertainty around the reduction in deaths, forming a 95% confidence interval for a robust understanding of handwashing’s effect.
7. Historical Context: The historical context was explored, discussing how Dr. Semmelweis’s discovery was initially ridiculed but eventually acknowledged as groundbreaking in medical science.
8. Conclusion: The project concludes with a strong affirmation of handwashing’s importance, substantiated by thorough statistical methods. A straightforward visual representation was also included to reinforce the conclusion.
We showcased the power of handwashing and how statistical analysis can shed light on historical medical practices. The findings illuminate a historically tragic era, emphasizing a life-saving practice that was regrettably not initially embraced.
In this comprehensive data analysis project, I aimed to understand the impact of the COVID-19 pandemic on a company’s operations and prepare the company for similar future scenarios. Here’s a detailed look at the process:
- Data Collection: I collected data from October 20, 2019, to April 20, 2020. The chosen period allowed me to compare the company’s performance before and during the pandemic.
- Data Analysis: Next, I analyzed the data to identify major shifts in website traffic and user behavior that occurred due to the pandemic. This analysis helped pinpoint changes in consumer buying patterns.
- Insight Generation: I converted the analyzed data into actionable insights, enabling the company to make data-driven and objective future business decisions.
- Data Sampling Strategy: I evaluated the existing data sampling strategy, identifying potential issues and suggesting improvements to enhance future data collection processes.
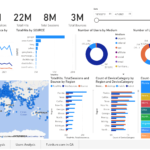
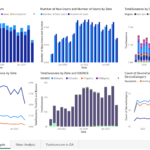
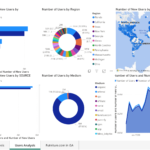
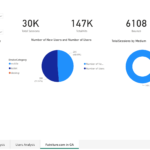
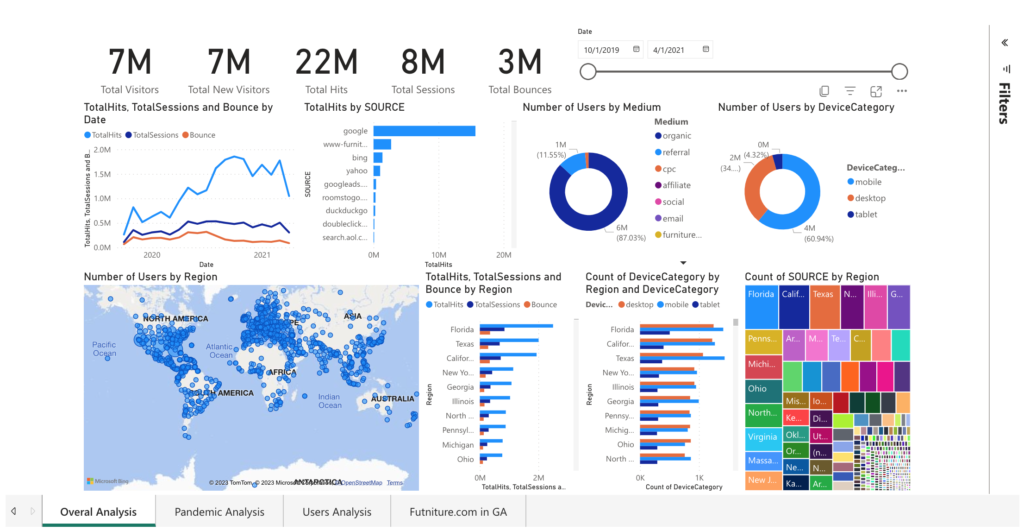
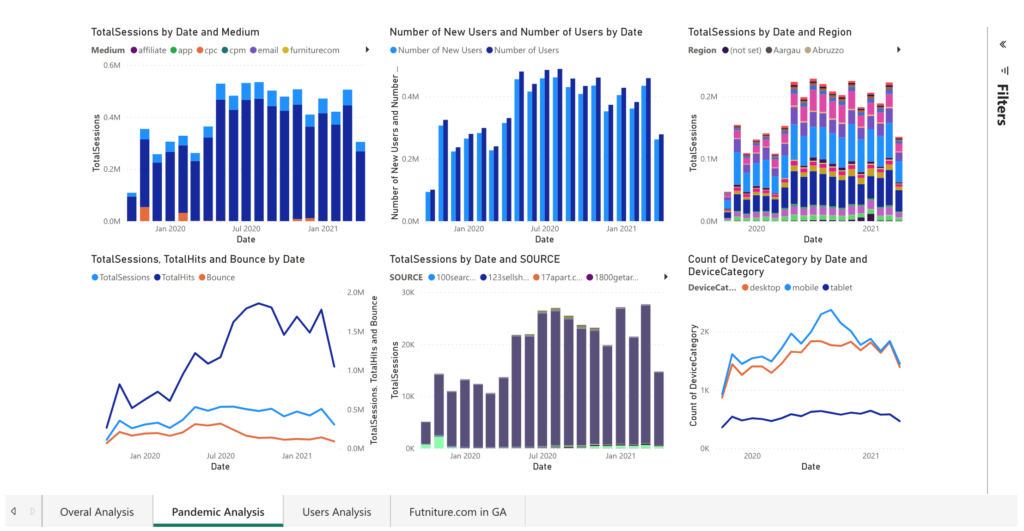
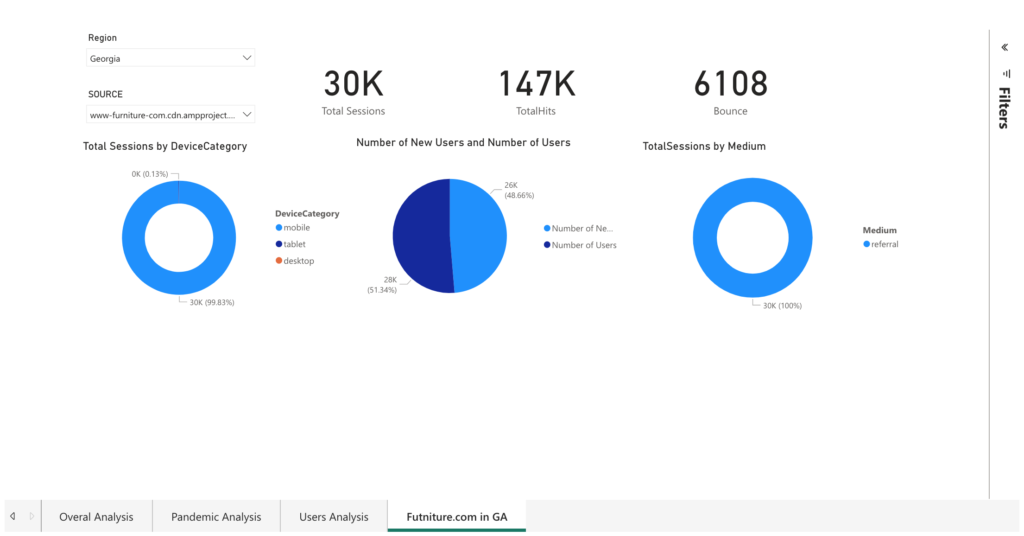
- Executive Dashboard: I created an executive dashboard using PowerBI to visualize the analysis and highlight key conversion metrics. This dashboard was the final deliverable for the executive team.
- Documentation and Presentation: I meticulously documented every aspect of the project, including an explanation of the analysis. I then presented the key findings and actionable suggestions to the executive team.
- Publishing the Report: I compiled a comprehensive business intelligence report, encompassing results, insights, and recommendations, and shared it with relevant stakeholders.
- Key Performance Indicators (KPIs): Finally, I identified three crucial KPIs to monitor, keeping in mind their feasibility and potential business impact.
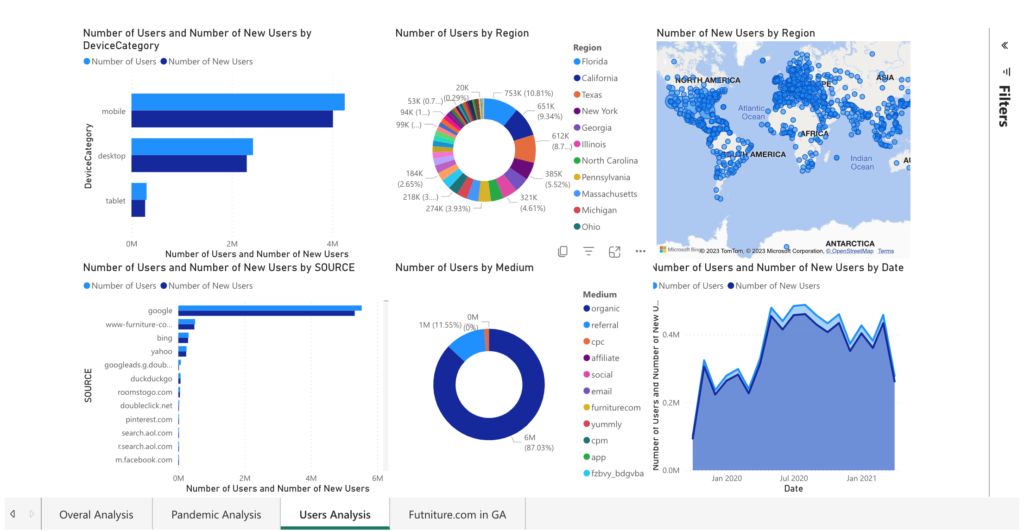
Following the completion of the project, I found an oscillating trend in the total sessions and user visits during the pandemic, which peaked in August 2020 before starting to decline. I proposed several strategies for business improvement, such as enhancing infrastructure to support increased traffic, refining the website UI for mobile devices, and focusing on the company’s performance in key states like Florida, California, Texas, New York, and Georgia.
I also pointed out issues with the data sampling, like the absence of detailed date information, a significant number of null values, unidentifiable traffic regions, and the lack of sales data in the dataset. These areas were noted for future improvements.
To conclude, I recommended tracking KPIs like the number of new and returning users, total hits per session, and bounce rate to monitor the website’s performance more accurately. An executive PowerBI dashboard was designed to display these insights, making this project a valuable asset for the company’s strategic planning during and after the pandemic.


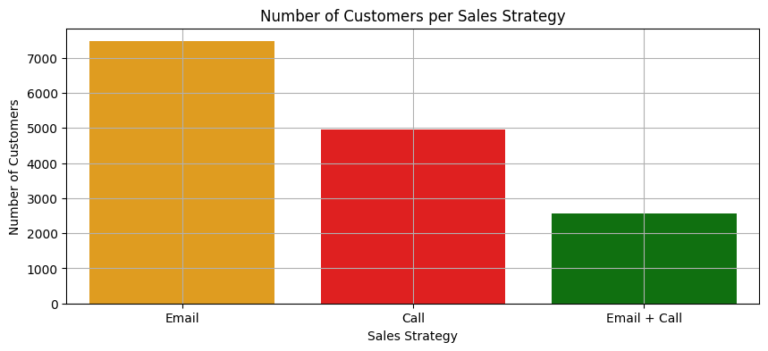
In a bid to enhance the sales performance of Pens and Printers, I embarked on a detailed analysis of their sales strategies, which included email, call, and a blend of email and call. My primary aim was to figure out which method maximized customer engagement and yielded the highest revenue.
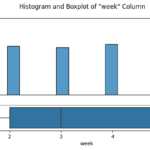
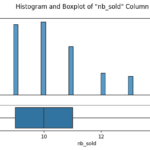
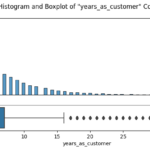
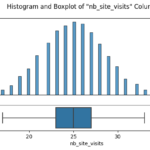
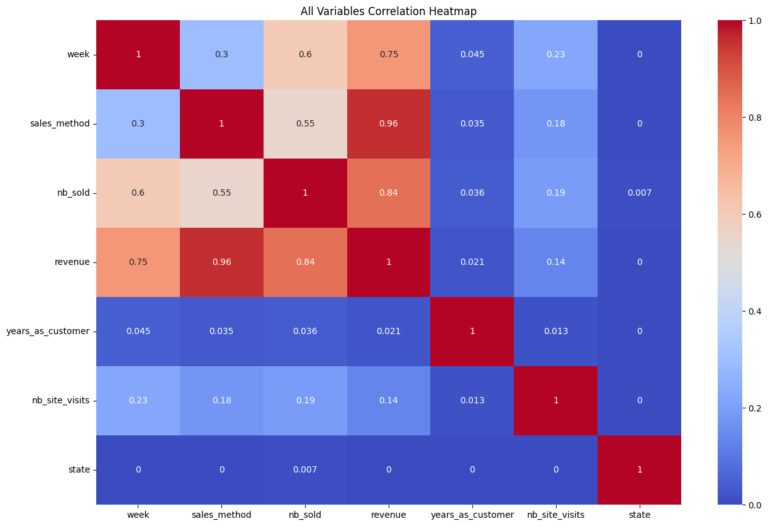
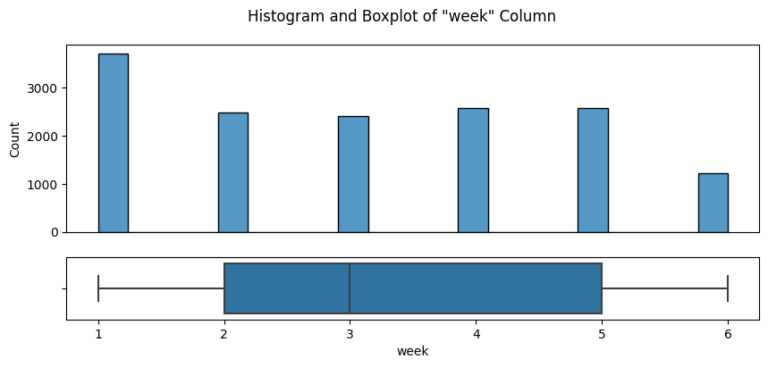
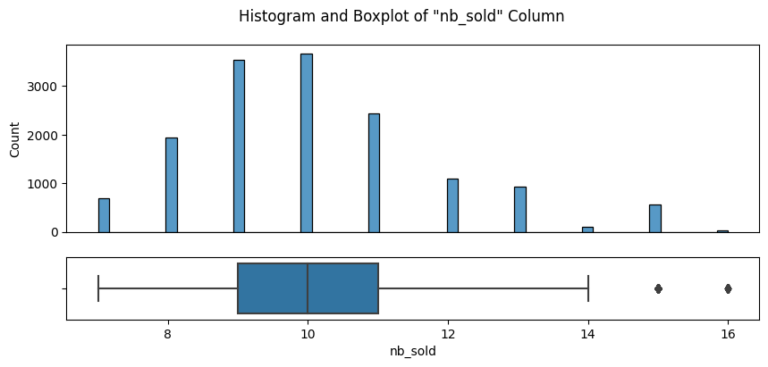
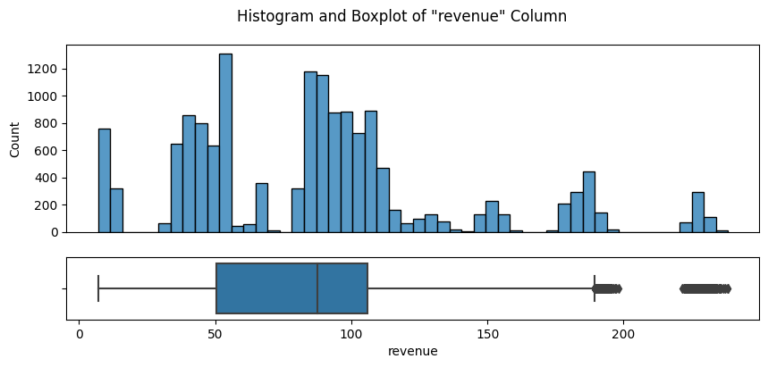
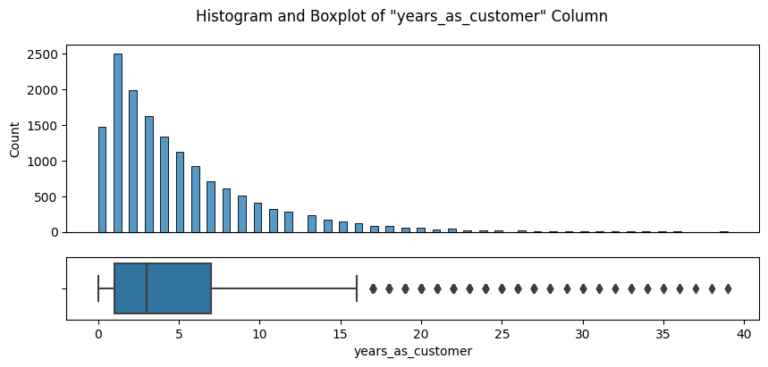
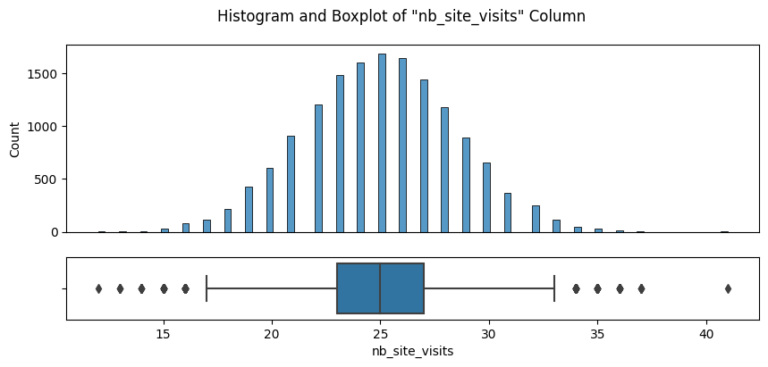
The journey began with an in-depth data validation and cleaning process, which involved a thorough examination of the dataset that Pens and Printers provided. The dataset encompassed various elements, including the week of the sale, the sales method employed, customer identifiers, the quantity of new products sold, the revenue generated, the duration of the customer-company relationship, the number of website visits by the customer over the past six months, and the customer’s location.
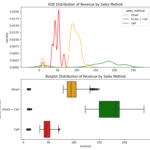
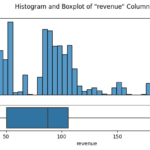
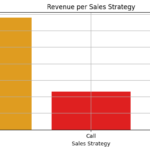
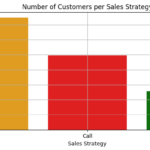
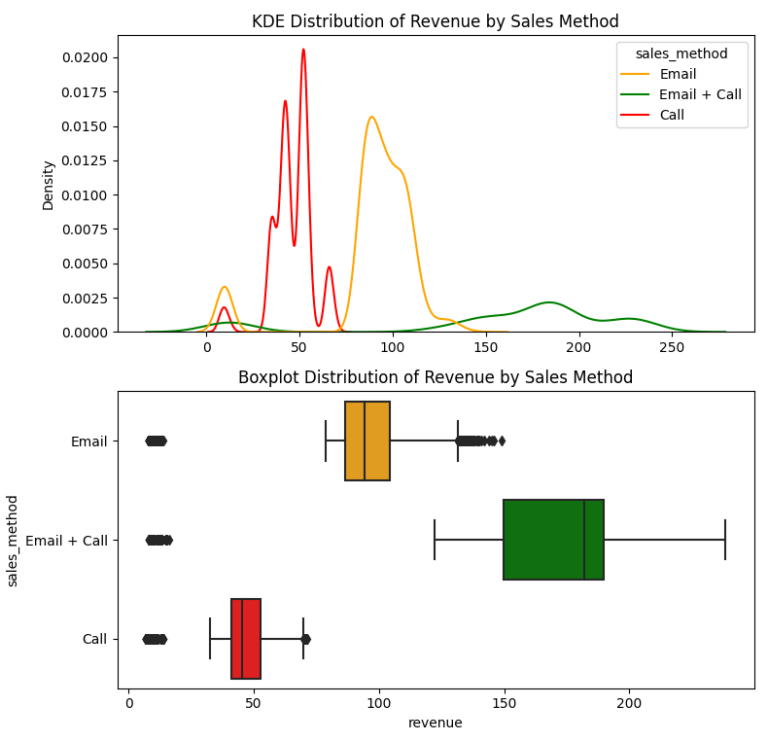
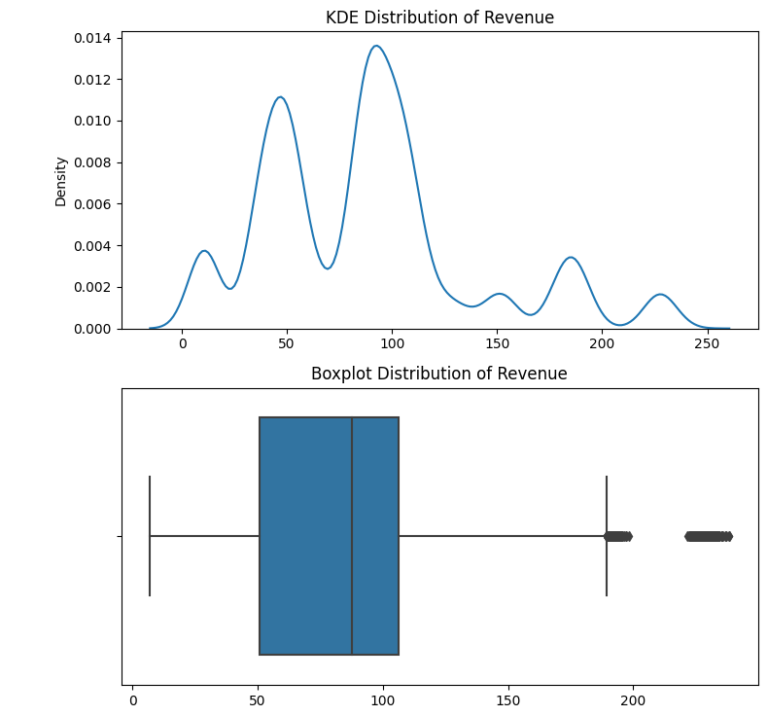
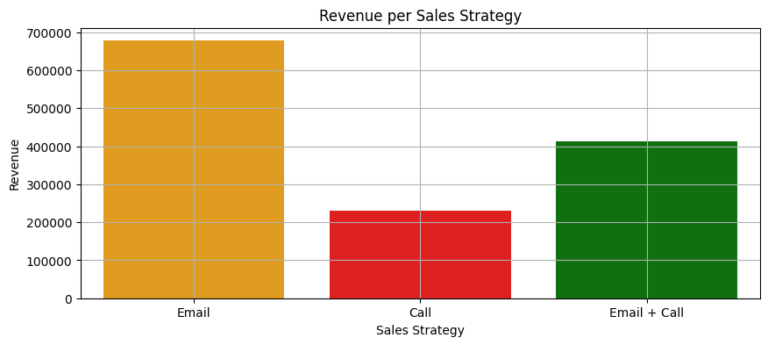
After ensuring the data was clean and fit for purpose, I initiated an exploratory analysis. I investigated how different sales strategies affected revenue generation and analyzed the distribution of revenue among these strategies. To my surprise, I found that the “Email + Call” strategy resulted in the highest average revenue per customer, despite the fact that the singular ‘Email’ and ‘Call’ methods were more frequently used.
I also studied revenue trends over time for each method. While the ‘Email’ method was the most profitable so far, it exhibited a declining trend. On the other hand, the ‘Email + Call’ method was on an upward trajectory, signifying its increasing effectiveness over time.
From my findings, I deduced that the ‘Email’ strategy, despite having the largest customer base and generating significant revenue, was on a downward trend. Conversely, the ‘Call’ method attracted a considerable number of customers, but generated the least revenue. Interestingly, the ‘Email + Call’ strategy, even with fewer customers, was more successful than the ‘Call’ strategy in terms of revenue generation.
I proposed ‘Revenue per Customer’ as a key performance indicator for Pens and Printers. This measure divides the total revenue generated by a sales method by the number of customers that the method attracted. This metric proved invaluable in understanding the efficiency of each sales strategy on a per-customer basis.
To conclude my analysis, I put forward some actionable recommendations. I advised Pens and Printers to focus on the ‘Email + Call’ approach due to its superior performance and increasing trend. For the ‘Email’ strategy, I recommended investigating its declining trend and finding ways to revitalize it. I suggested that Pens and Printers refine their ‘Call’ approach, despite its upward trend, due to its lower profitability. Finally, I emphasized the importance of consistently tracking the ‘Revenue per Customer’ metric for each sales method to make informed and data-driven decisions for future strategies.
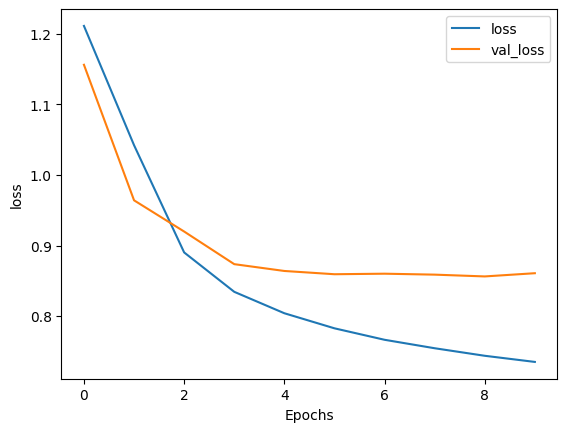
In this initiative, my objective was to construct a machine learning model capable of discerning sentiments from sentences plucked from the Rotten Tomatoes movie reviews dataset. The core aim was to decode and grasp the emotions encapsulated in these sentences, and then sort them into distinctive sentiment categories.
The Rotten Tomatoes dataset contained an extensive collection of movie reviews, already preprocessed and segmented into individual sentences. Each sentence carried a corresponding sentiment label, ranging from negative to positive sentiments. To be precise, the sentiment labels were classified as follows:
0 – Negative 1 – Somewhat Negative 2 – Neutral 3 – Somewhat Positive 4 – Positive
Leveraging natural language processing (NLP) techniques and deep learning models, I delved into and processed the textual data. The project unfolded across the following phases:
- Data Collection: My first step was to procure the Rotten Tomatoes dataset, which comprised sentences alongside their corresponding sentiment labels.
- Data Preprocessing: I sanitized and preprocessed the text data, eliminating special characters, stop words, and tokenizing the sentences. Furthermore, I transposed the text into numerical sequences and implemented padding to ensure a uniform input length.
- Model Development: I engineered a deep learning model, possibly a Recurrent Neural Network (RNN) or Convolutional Neural Network (CNN), designed to classify the sentiment of sentences. I incorporated an embedding layer to present words in a dense vector space, followed by additional layers for feature extraction and classification.
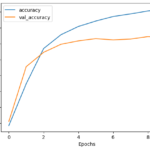
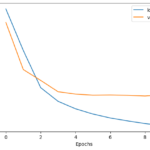
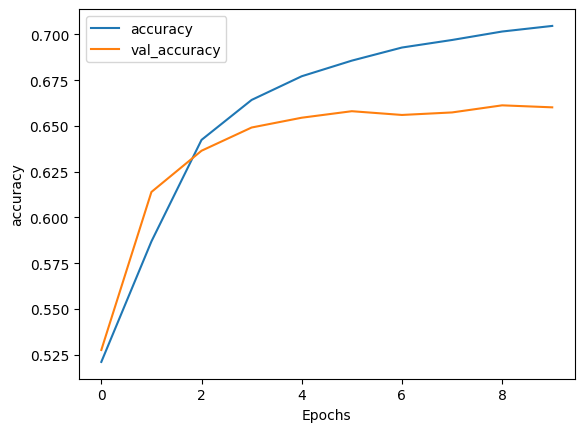
- Model Training: I trained the model on the preprocessed data using an apt loss function and optimizer. Concurrently, I kept a keen eye on the model’s performance on a validation set to mitigate overfitting.
- Model Evaluation: I evaluated the performance of the trained model on a test dataset, gauging metrics such as accuracy, precision, recall, and the F1 score.
- Prediction and Deployment: I deployed the trained model to predict the sentiment of new, unseen movie review sentences. If necessary, I could also deploy the model as a web service or API for real-time sentiment analysis.
This venture enlightened me on public perception of movies and yielded valuable insights into the sentiment manifested in movie reviews. It also hinted at possible applications in a myriad of domains, such as interpreting customer reviews, social media comments, or any other textual data where sentiment analysis is essential. My model displayed an accuracy that placed me among the top 40 submissions on the leaderboard.
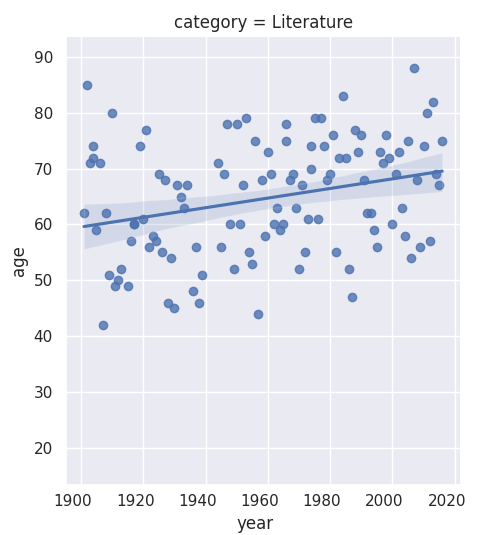
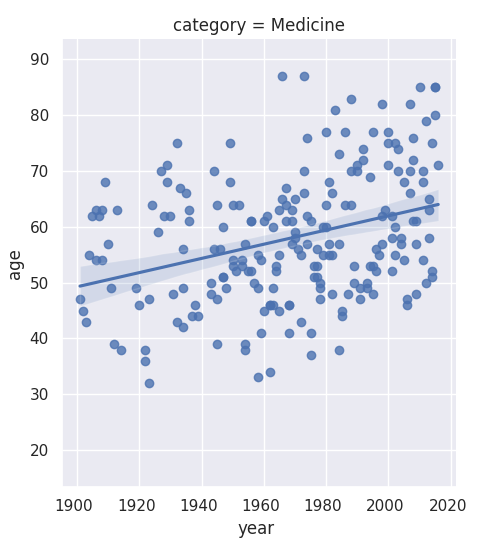
In this project, I analyze the Nobel Prize, one of the most prestigious scientific awards worldwide, by exploring data on its recipients from 1901 to 2016. I start by loading the Nobel Prize dataset into a Pandas DataFrame and take a preliminary look at the initial laureates.
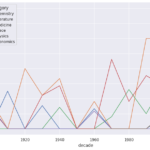
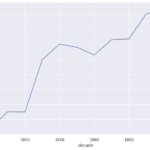
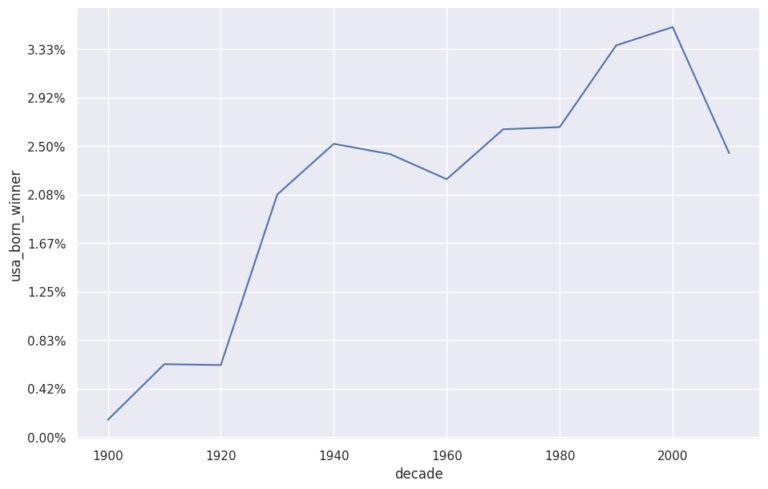
My analysis delves into the gender and nationality distribution of the laureates. It turns out that the majority of the recipients have been men since the inception of the award, and the United States holds the record for the most laureates. Interestingly, the USA’s domination of the Nobel charts began in the 1930s.
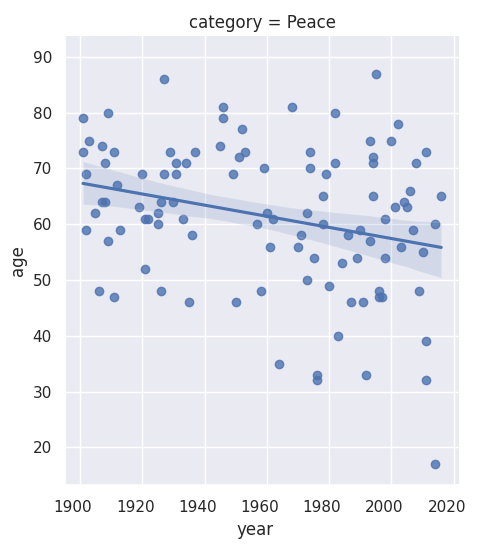
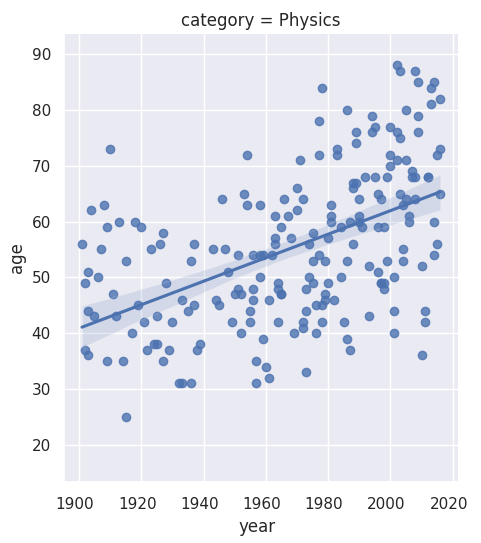
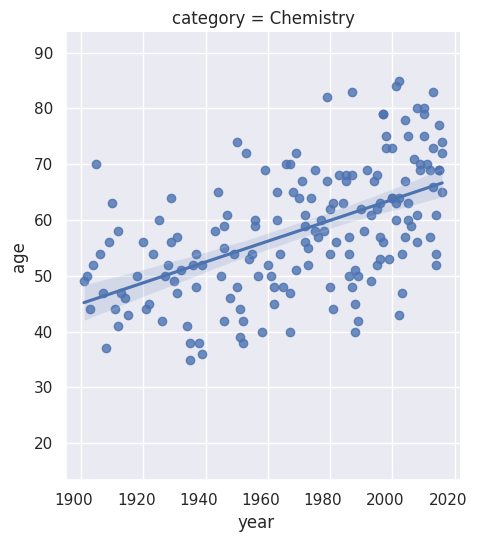
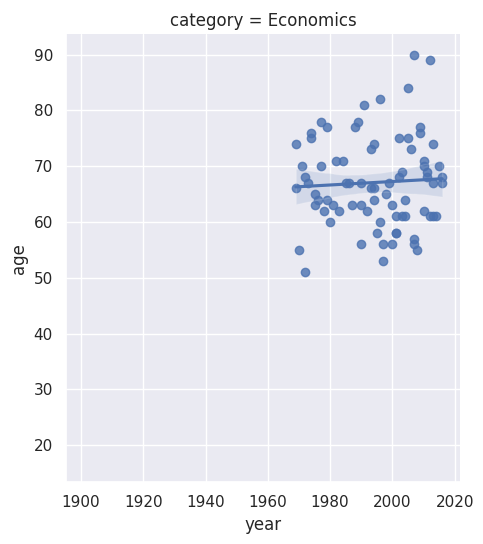
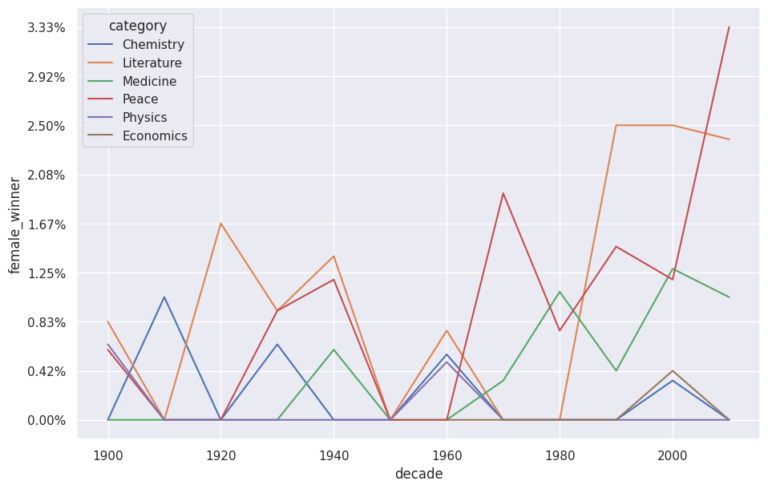
Next, I investigate the gender imbalance across the six different Nobel Prize categories. There is a noticeable gender disparity in the fields of physics, economics, and chemistry. In contrast, the field of medicine shows a slightly more positive trend towards gender balance, and the literature category has become more balanced recently. I also identify the first woman ever to receive a Nobel Prize.
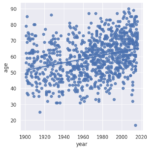
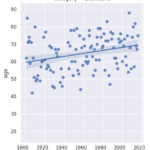
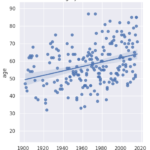
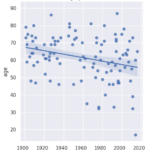
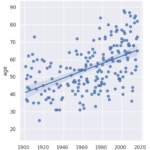
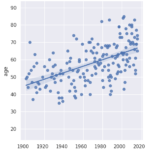
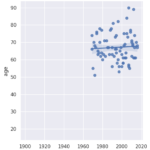
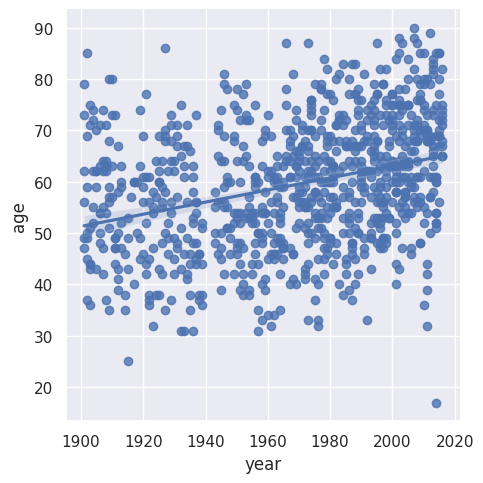
I further examine the laureates’ age at the time of receiving their prizes and delve into the age variations between different prize categories. Over the years, the laureates’ average age has increased from around 55 in the early 1900s to nearly 65 today. There is also a higher density of laureates in recent times due to an increase in shared prizes. Interestingly, laureates in the peace category seem to be getting younger over time.
To wrap up, I identify the oldest and youngest laureates in the history of the Nobel Prize and highlight the youngest laureate in 2014. This project provides a comprehensive analysis of the Nobel Prize, revealing historical trends and providing insights into the laureates’ demographic characteristics.
The project focuses on conducting a comprehensive analysis of the Android app market, which is a rapidly growing industry that has revolutionized the way people interact with technology. With mobile apps becoming ubiquitous and easy to create, it is essential to analyze the market to gain insights that can help to drive growth and retention. The analysis involves comparing over ten thousand apps in Google Play across different categories and working with two files: apps.csv and user_reviews.csv.
The data cleaning process is an essential step in the analysis, as it ensures that the data is in a format that is usable for subsequent calculations. In the case of this project, the Installs and Price columns in the apps.csv file need to be cleaned to remove special characters so that the columns can contain only digits. The project also involves correcting data types to make Installs and Price numeric and working with the four features, Installs, Size, Rating, and Price.
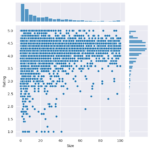
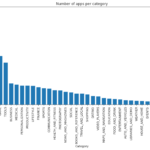
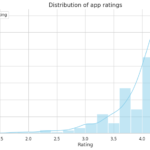
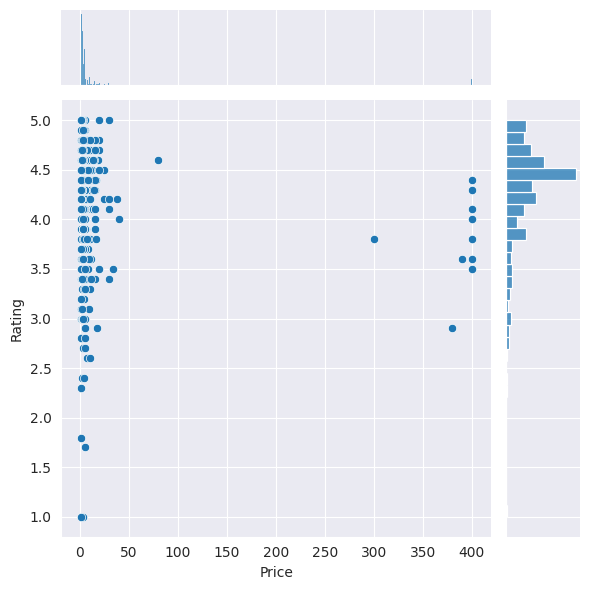
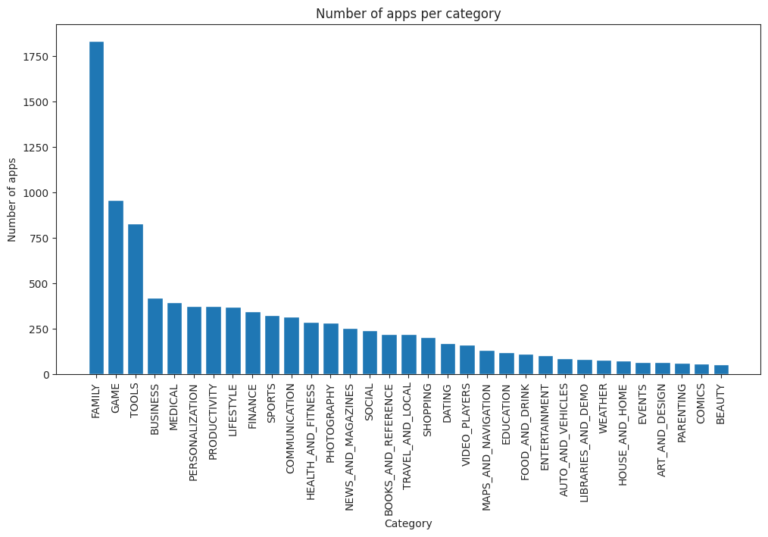
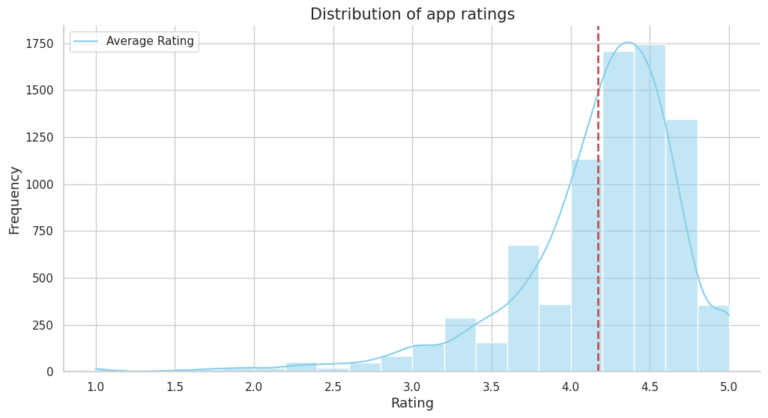
The analysis includes exploring app categories to determine which category has the highest share of (active) apps in the market, whether any specific category dominates the market, and which categories have the fewest number of apps. The project finds that Family and Game apps have the highest market prevalence, but Tools, Business, and Medical apps are also at the top. The project also examines the distribution of app ratings to determine how all the apps perform on average, and it finds that the majority of the apps are highly rated.
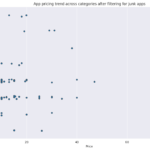
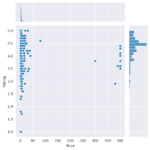
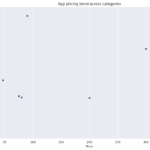
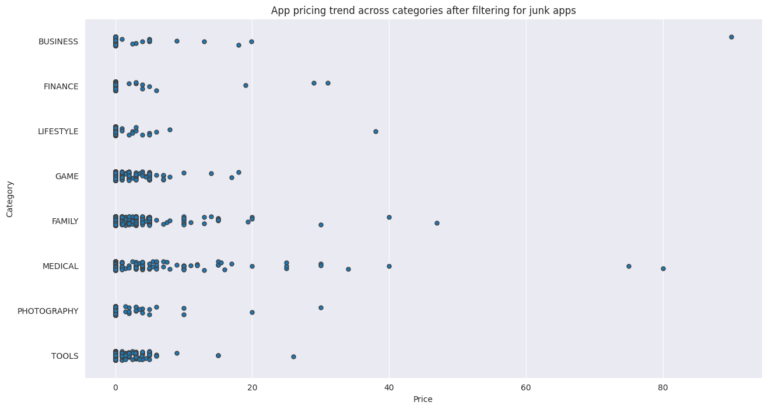
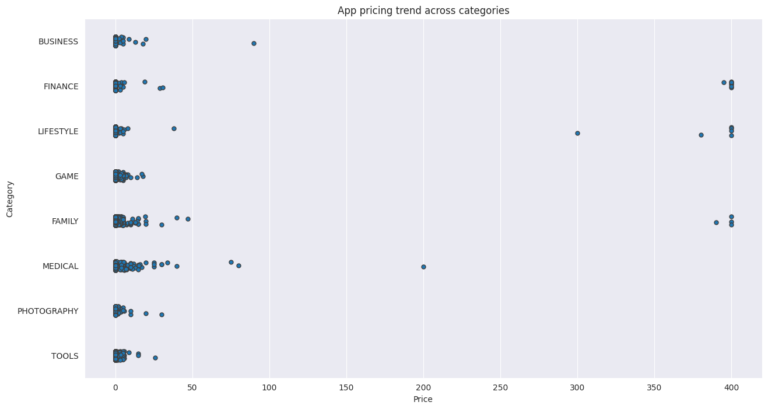
The project analyzes the relationship between app size and price, and it finds that the majority of top-rated apps range from 2 MB to 20 MB, while the vast majority of apps price themselves under $10. The project also examines the relationship between app category and app price, finding that Medical and Family apps are the most expensive, and all game apps are reasonably priced below $20.
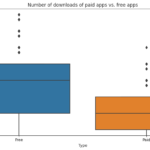
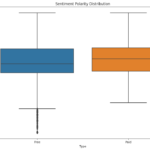
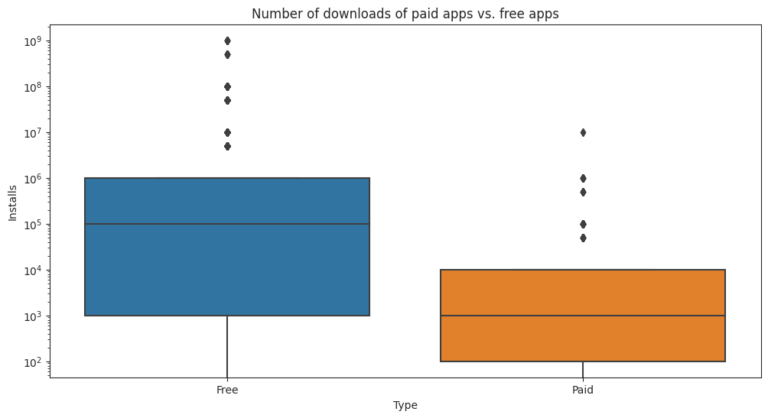
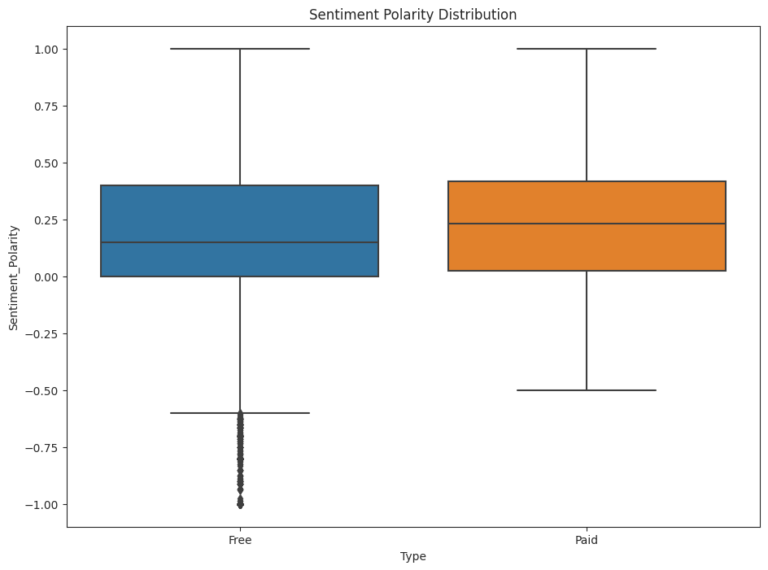
The project also filters out “junk” apps that don’t have a purpose and examines the popularity of paid vs. free apps. It finds that paid apps have a relatively lower number of installs than free apps, but the difference is not as stark as expected. Finally, the project conducts sentiment analysis of user reviews to determine how people feel about the app. It finds that free apps receive a lot of harsh comments, while paid apps never receive extremely negative reviews, which may indicate that paid apps are of higher quality.
The project provides a comprehensive overview of the Android app market, which is useful for anyone looking to gain insights into the market. The findings can help developers to develop strategies to drive growth and retention, make informed decisions about pricing, and create high-quality apps that meet users’ needs.
The project detailed herein is an analytical endeavor I undertook, utilizing a dataset provided by BusinessFinancing.co.uk. The goal was to explore and identify the oldest operational businesses in almost every country worldwide. The study was guided by my intent to better understand the characteristics that have allowed such businesses to endure the test of time.
In this process, I scrutinized the oldest business within each nation and collated my findings into a rich dataset. This dataset, which can be accessed in the datasets directory, encapsulates information such as the business’s name, its industrial sector, geographical location, and the year it was founded.
The driving objective behind this project was to delve deeper into the histories of these long-standing businesses and understand the factors that contributed to their longevity. Through my research, I discovered insights into integral factors that these businesses have harnessed – strong leadership, the ability to adapt to changing circumstances, and a culture of innovation have been key elements in their sustained success.
In sum, this project highlighted the need to understand and learn from the characteristics that have underpinned the success of historic, enduring businesses. Such insights can guide modern business practices, fostering a new generation of companies built to last.
To predict people who would spend more on healthcare in the upcoming year, we followed these steps:
- Data collection: We collected data on healthcare expenses, patient demographics, medical history, diagnosis, and treatment plans from various sources such as electronic health records, claims data, and clinical notes.
- Data cleaning and preprocessing: We cleaned and preprocessed the data to remove any duplicates, missing values, or inconsistencies.
- Feature engineering: We extracted and created new features from the data that can be used to predict healthcare expenses. Some of the features that we extracted from the data included patient age, gender, medical history, diagnosis, treatment plan, and healthcare provider.
- Model selection: We chose a machine learning model that could be used to predict healthcare expenses. Some of the popular machine learning models for expense prediction in healthcare include linear regression, decision trees, and random forests.
- Model training: We trained the machine learning model on the preprocessed data and features.
- Model evaluation: We evaluated the performance of the model using various metrics such as mean squared error (MSE), root mean squared error (RMSE), and R-squared.
- Feature importance analysis: We analyzed the importance of each feature in the model to identify which features had the most significant impact on healthcare expenses.
- Prediction and analysis: We used the trained model to predict which patients would spend more on healthcare in the upcoming year. We analyzed the results to identify specific factors that contributed to higher healthcare expenses, such as chronic conditions or hospitalizations.
- Actionable insights and recommendations: We provided actionable insights and recommendations to healthcare providers and payers on how to lower healthcare costs for high-risk patients. For example, recommendations could include providing preventative care to manage chronic conditions, reducing unnecessary hospitalizations, or improving patient education to promote healthy lifestyles.
By following these steps, we developed a state-of-the-art model for predicting healthcare expenses and provided specific recommendations to lower healthcare costs. The key to achieving state-of-the-art performance was to use advanced machine learning techniques and to continuously update and refine the model with new data.
The Scala programming language has a repository of real-world project data with over 30,000 commits and a history of over ten years. As a mature, general-purpose language, Scala has gained popularity among data scientists in recent years.
One advantage of Scala is that it is an open source project, meaning that its entire development history is publicly available, including information on who made changes, what changes were made, and code reviews.
In this project, we will explore and analyze the Scala project repository data, which includes data from both Git (version control system) and GitHub (project hosting site). Through data cleaning and visualization, we aim to identify the most influential contributors to the development of Scala and uncover the experts in this field.
This project focuses on exploring and analyzing a dataset of episodes from the American version of the popular TV show “The Office”. The project aims to understand how the popularity and quality of the series varied over time by examining different characteristics of each episode, including ratings, viewership, guest stars, and more.
The dataset used in this project, which was downloaded from Kaggle, contains information on 201 episodes over nine seasons. The information provided for each episode includes its canonical episode number, the season in which it appeared, its title and description, the average IMDB rating, the number of votes, the number of US viewers in millions, the duration in minutes, the airdate, the guest stars in the episode (if any), the director of the episode, the writers of the episode, a True/False column for whether the episode contained guest stars, and the ratings scaled from 0 (worst-reviewed) to 1 (best-reviewed).
By analyzing this dataset, we can gain insights into how different factors impacted the popularity and quality of the show. For example, we may discover that episodes with guest stars tended to have higher viewership or ratings, or that certain directors or writers were associated with particularly successful or popular episodes. Overall, this project provides an interesting and in-depth analysis of one of the most popular and beloved TV shows of all time.
The problem was defined: The first step was to identify the problem to be solved, such as predicting stock prices based on social media sentiment analysis.
Data was collected and processed: Once the problem was defined, the relevant data was collected and processed. In this case, data was collected from Twitter using data mining techniques such as web scraping or API calls.
Data was cleaned and preprocessed: After collecting the data, it was cleaned and preprocessed to remove noise, irrelevant information, and duplicates. Text preprocessing was also performed, such as tokenization, stemming, and stop-word removal.
Sentiment analysis was performed: Sentiment analysis was performed on the preprocessed Twitter data to extract sentiment information, such as positive, negative, or neutral sentiment. This was done using techniques such as Naive Bayes, Support Vector Machines (SVM), or Recurrent Neural Networks (RNNs).
Correlation between sentiment and stock prices was analyzed: Once sentiment analysis was performed, the correlation between sentiment and stock prices was analyzed. This was done using statistical techniques such as regression analysis or machine learning algorithms such as Random Forest, Decision Trees, or Gradient Boosting.
The model was validated: After analyzing the correlation, the model was validated to ensure its accuracy and reliability. This was done using techniques such as cross-validation or holdout validation.
The model was deployed: Finally, the model was deployed to predict stock prices based on Twitter sentiment analysis. This was done using various deployment options, such as cloud services or on-premise deployment.
Twitter data mining and stock market prediction projects involve a combination of data mining, natural language processing (NLP), sentiment analysis, and machine learning techniques to extract valuable insights from social media data and predict stock prices.
We scraped and stored web data and implemented machine learning algorithms to predict the outcome of NBA games, achieving state-of-the-art performance. Here are the steps we followed:
- Data collection: We collected data on NBA games, including team statistics, player statistics, game schedules, and game results, from various sources such as NBA.com, ESPN, or Basketball-Reference.com.
- Data cleaning and preprocessing: We cleaned and preprocessed the data to remove any duplicates, missing values, or inconsistencies.
- Feature engineering: We extracted and created new features from the data that can be used to predict the outcome of NBA games. Some of the features that we extracted from the data included team win-loss records, player stats, team performance in specific game situations, and home court advantage.
- Model selection: We chose a machine learning model that could be used to predict the outcome of NBA games. Some of the popular machine learning models for game prediction include SVM, logistic regression, decision trees, and neural networks.
- Model training: We trained the machine learning model on the preprocessed data and features.
- Model evaluation: We evaluated the performance of the model using various metrics such as accuracy, precision, recall, and F1 score.
- Feature importance analysis: We analyzed the importance of each feature in the model to identify which features had the most significant impact on the outcome of NBA games.
- Prediction and analysis: We used the trained model to predict the outcome of NBA games. We analyzed the results to identify specific factors that contributed to winning or losing, such as team chemistry, player injuries, or coaching strategy.
- Playoff prediction: Based on the regular season results and the model predictions, we predicted which teams would make the playoffs and how far they would go in the playoffs.
By following these steps, we were able to scrape and store web data and implement machine learning algorithms to predict the outcome of NBA games, achieving state-of-the-art performance. To achieve state-of-the-art performance, we used advanced machine learning techniques, such as deep learning, and continuously updated and refined the model with new data.
As a team, we analyzed historical data on airport processes such as passenger arrivals, check-in times, security check times, boarding times, flight schedules, and other relevant information. Based on this data, we simulated the airport processes using software tools like Arena, Simul8, or AnyLogic. Using the simulation models, we proposed an optimized airport layout that minimized the operation cost and passenger waiting time.
We defined our optimization objectives, which included minimizing passenger waiting times, reducing flight delays, and minimizing operational costs. We applied optimization techniques such as response surface methodology, Taguchi methods, and DOE to identify the most significant factors affecting the airport processes and their optimal levels.
We analyzed and optimized the airport layout, passenger flows, and resource allocation to minimize passenger waiting times, reduce flight delays, and minimize operational costs. To validate our results, we compared the optimization models’ predictions with real-world data and assessed the impact of the proposed changes.
Finally, we implemented the proposed changes in the airport operations, layout, and resource allocation to improve the airport processes’ efficiency and achieve the optimization objectives. Overall, our work as a team helped improve airport efficiency and passenger experience by proposing an optimized airport layout that minimized operation costs and passenger waiting time.
Defined the problem and goals: The first step was to identify the problem and set specific goals for improvement. In this case, the goal was to increase the RGA first pass yield (FPY) by 30%.
Collected and analyzed data: Data related to the manufacturing process was collected and analyzed. This included data on equipment, materials, personnel, and other variables that could impact the yield.
Performed root cause analysis: Statistical tools and techniques such as Pareto analysis, Ishikawa diagrams, and statistical process control (SPC) were used to identify the root causes of the problem. These techniques helped identify the factors that contributed to low yield and prioritize them based on their impact.
Brainstormed potential solutions: Based on the root cause analysis, potential solutions to improve the process were brainstormed. This could involve changes to equipment, materials, personnel, or the manufacturing process itself.
Reduced variability: Changes were implemented to reduce variability in the manufacturing process. This could involve improving equipment maintenance, standardizing processes, or increasing the accuracy of measurements.
Controlled the process: Control plans and procedures were developed to ensure the process was maintained at an optimal level over time. This involved monitoring key process parameters and implementing corrective actions when necessary.
Measured success: The success of the process improvements was measured using metrics such as RGA first pass yield (FPY) and other key performance indicators. These metrics were tracked over time to ensure the improvements were sustained.
Overall, the goal of the project was to identify and implement changes to the semiconductor manufacturing process that improved the RGA first pass yield (FPY) by 30%. The project involved a systematic approach to problem-solving that included data collection and analysis, root cause analysis, brainstorming potential solutions, reducing variability, controlling the process, and measuring success over time
In the Database Design for Airlines project, I designed a database that could manage all aspects of an airline’s operations. To accomplish this, I developed data models that captured relevant data entities and their relationships and defined attributes and constraints for each entity.
As part of the database design, I ensured that the system could track flight information, such as departure and arrival times, flight numbers, and aircraft types. I also included capabilities to store customer and employee information, such as personal details, contact information, and login credentials.
Moreover, the database managed information about the airline’s fleet, such as aircraft types, seating arrangements, maintenance schedules, and availability. It also tracked ticket sales, reservations, cancellations, and refunds, along with payment details and other financial transactions.
To ensure the database design met the airline’s business requirements, I applied various constraints, including data validation rules, referential integrity, and security measures. My ultimate goal was to create an efficient, reliable, and scalable database system that could seamlessly support the airline’s operations.
Extracted historical procurement, design, manufacturing, and sales data. Predicted costs and improved the accuracy and speed of the bidding process.
To improve the company’s production efficiency, I developed a data visualization application that collected data from sensors on the production line and combined it with information from the company’s ERP system to generate real-time insights and visualizations. The optimized data structure was designed to handle large volumes of data and support real-time analytics and reporting. This helped the company to identify patterns in the production process, analyze customer feedback, and generate reports on inventory levels, production costs, and sales performance.
In addition to developing the data visualization application, I also developed algorithms and models using machine learning techniques to analyze the data and identify patterns and trends. I ensured scalability, automation, and security of the application, which allowed managers to interact with the data and make informed decisions based on the insights and analytics provided.
To ensure data consistency and integrity, I integrated data from various sources and improved them to meet data quality and accessibility standards. I collaborated with stakeholders to understand business requirements and created functional and technical designs for the data visualization application. I also documented data visualization artifacts for future updates and changes.
Throughout the integration process, I encountered various data quality issues that required collaboration with data architects and IT professionals to address. Ultimately, my efforts led to the development of a new data visualization application that provided managers with real-time insights and visualizations to identify bottlenecks and areas for improvement, as well as alerts when issues arose.
Website design, content production, and search engine optimization (SEO) lead to a 10 percent increase of annual revenue.
The primary objective of this project is to design and optimize nozzles through experimental methods and subsequent data analysis. We aim to create a nozzle design that maximizes flow efficiency, reduces pressure losses, and can be effectively applied in various industrial or aerospace applications.
Methodology:
- Data Collection: To start, we collect data on existing nozzles under various conditions like flow rate, pressure, temperature, etc. This includes both qualitative observations and quantitative measurements. The methods of data collection could range from direct measurement to the use of sensors or imaging techniques.
- Experiment Design: We set up a series of experiments, manipulating variables such as nozzle shape, size, material, and operating conditions. The aim here is to understand the impact of these variables on the nozzle’s performance. The experimental design should be systematic and controlled, allowing us to draw meaningful conclusions from the results.
- Data Analysis: The collected data is then analyzed using statistical methods, computational fluid dynamics (CFD) simulations, or machine learning techniques to derive relationships between the variables and the nozzle’s performance. This step provides insights into how to improve nozzle design and operation.
- Prototype Design: Based on the analysis, we design and fabricate nozzle prototypes incorporating the optimal characteristics identified.
- Testing and Validation: The newly designed nozzles are then subjected to rigorous testing under different conditions to validate their performance. The data collected from these tests are again analyzed and compared with the initial data set to measure the level of improvement.
The project has provided a profound understanding of factors impacting nozzle performance, leading to an optimized design that increases efficiency. The result is a versatile nozzle that can enhance various applications, from vehicle fuel systems to rocket propellants. Through meticulous lab experiments and aeration data analysis, a circular nozzle was designed, improving fluid oxygen saturation by 15%, marking a significant milestone in fluid dynamics efficiency.
**Project Overview:**
I was involved in a significant data engineering project for a large e-commerce company. The company needed a robust infrastructure to analyze customer behavior in real-time to enhance user experience, offer tailored promotions, and refine their business strategy. I had to work with multiple data sources, including online transactions, clickstream data, customer reviews, social media interactions, and inventory details.
**Step 1: Requirement Gathering and Planning**
My first step was to comprehend the business objectives and the nature of the data sources. I also had to define the specific requirements, such as real-time analysis needs. Armed with this information, I planned the data pipeline architecture, including the technology stack, the data model, and the data transformation processes.
**Step 2: Data Ingestion**
Next, I focused on the data ingestion layer. This involved establishing connections with various data sources and extracting the data. This was challenging due to the different types of data systems, including databases, APIs, and logs. To handle this, I implemented Apache Kafka for real-time data ingestion.
**Step 3: Data Processing and Transformation**
Once the data was ingested, I proceeded with data cleaning and transformation processes to ensure data was in the right format and quality for analysis. This step involved removing duplicates, handling missing values, and transforming data into a specific structure. I used Apache Spark for this stage.
**Step 4: Data Storage and Management**
Upon cleaning and transforming the data, I loaded it into a centralized data warehouse. Here, all data was stored for subsequent analysis. For the storage system, I chose Google BigQuery based on its compatibility with our requirements.
**Step 5: Testing and Monitoring**
I thoroughly tested the pipeline to verify its functionality, data accuracy, performance, and reliability. Once deployed, I established a regular monitoring regimen using Apache Airflow to detect and troubleshoot any issues swiftly.
**Step 6: Documentation and Maintenance**
After the successful deployment of the pipeline, I documented the entire process and architecture, making it accessible for any future updates or maintenance. Given that customer behaviors and business requirements are ever-evolving, I ensured to routinely update and refine the pipeline to accommodate new data sources, modify the data transformation logic, or scale the pipeline to handle increased data.
In summary, this project was an excellent opportunity to apply my data engineering skills in a real-world setting, designing and implementing a comprehensive solution to meet a large e-commerce company’s complex data needs.